Business Challenge
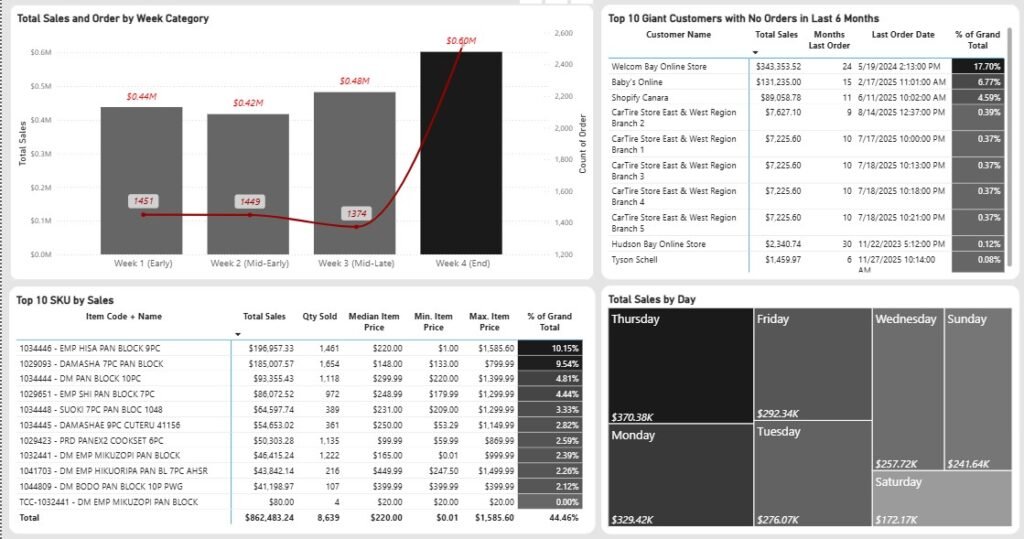
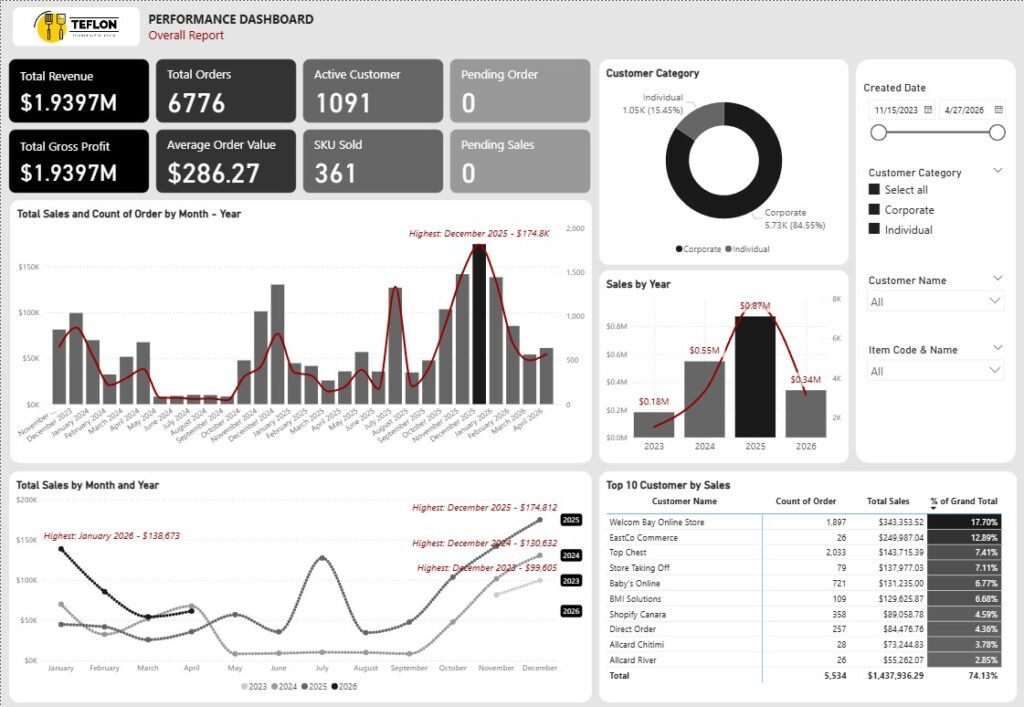
The kitchen supplier needed a centralized dashboard to monitor key sales and business performance indicators, including sales volume, revenue, order trends, profit, top buyers, and SKU performance. The dashboard also needed to be accessible and easy to interpret for color-blind users.
Solution
Developed an interactive dashboard with a color-blind-friendly visual design, using accessible color combinations and clear visual cues to ensure key insights could be easily interpreted. The dashboard provides interactive analysis of sales performance, revenue, order trends, profitability, top buyers, and SKU performance.
Tools & Technologies
– Power BI
– SQL
– Excel
Outcome
Delivered an accessible and interactive dashboard that enables users to monitor key business KPIs while improving data readability and usability for color-blind users.
Preview
Video Preview