Business Challenge
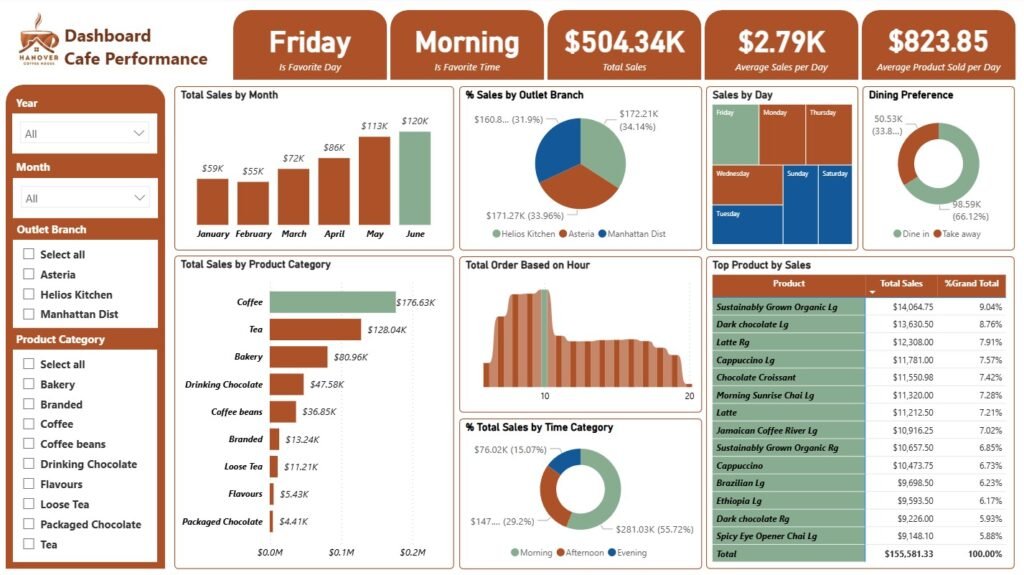
The coffee shop needed a centralized view of performance across multiple branches to understand sales trends, identify top-performing products and periods, and better understand customer preferences.
Solution
Developed an interactive performance dashboard that consolidates sales data from multiple branches, providing insights into overall sales performance, favorite products, peak sales periods, and customer preferences. The dashboard enables users to compare branch performance and explore key trends across different dimensions.
Tools & Technologies
– Power BI
– Excel
Outcome
Provided a centralized view of multi-branch performance, helping management identify sales trends, best-selling products, peak business hours, and customer preferences to support data-driven decisions.
Preview